

Trading indicators are the essential tools that transform raw price data into actionable signals. Whether you’re a day trader or swing trader, mastering the right trading indicators can dramatically improve your timing, reduce false signals, and give you a quantifiable edge in any market condition.
In the dynamic world of financial markets, staying ahead of the curve is crucial for trading success. While many traders rely on traditional indicators, a set of unconventional tools can provide a significant edge. This article explores seven powerful, yet often overlooked, trading indicators that can revolutionize your market approach.
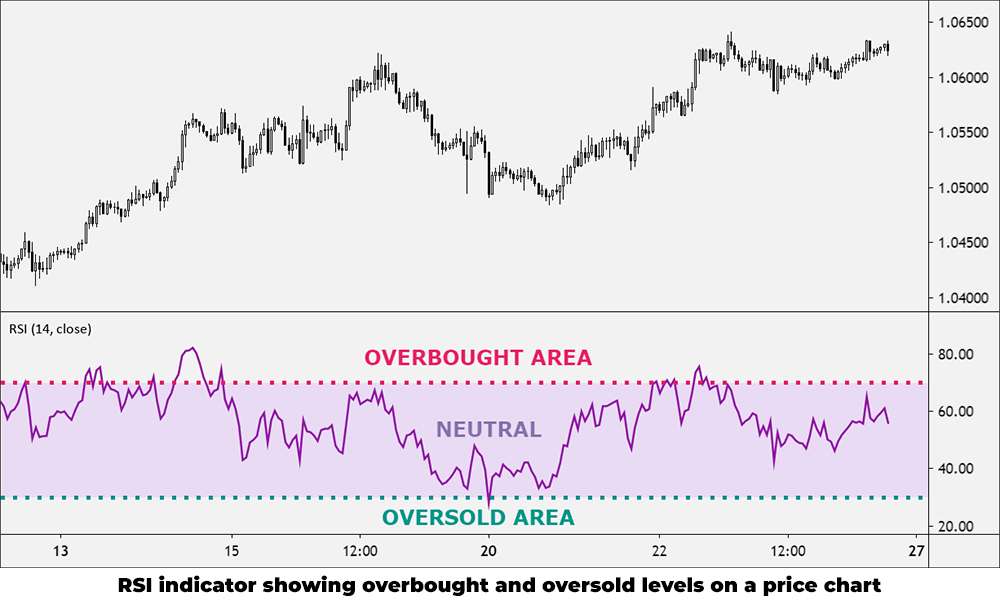
Relative Strength Index (RSI): Momentum Master
The RSI is a versatile momentum oscillator that measures the speed and magnitude of price movements. Ranging from 0 to 100, it helps traders identify:
- Overbought conditions (above 70).
- Oversold conditions (below 30).
- Potential trend reversals.
- Bullish and bearish divergences.
By incorporating RSI into your analysis, you can gain valuable insights into market momentum and potential turning points.
Fibonacci Retracement: Nature’s Market Map
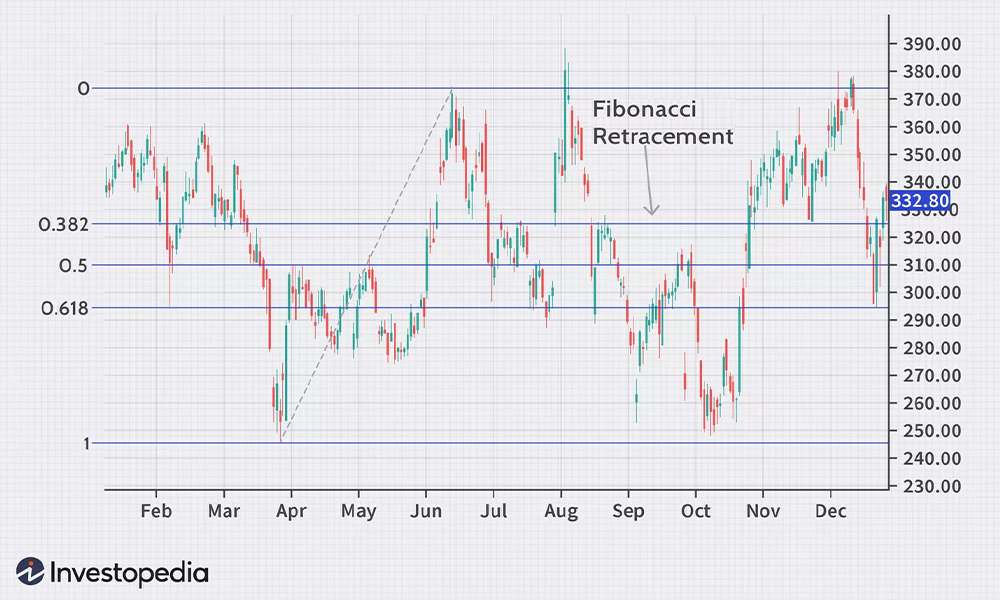
Based on the famous Fibonacci sequence, this indicator helps traders identify key support and resistance levels. By drawing horizontal lines at specific ratios (23.6%, 38.2%, 50%, 61.8%, and 78.6%), traders can:
- Spot potential reversal points.
- Set strategic entry and exit levels.
- Confirm other technical analysis signals.
Fibonacci Retracement can be particularly powerful when combined with trend analysis and other indicators.
Ichimoku Cloud: The All-in-One Indicator
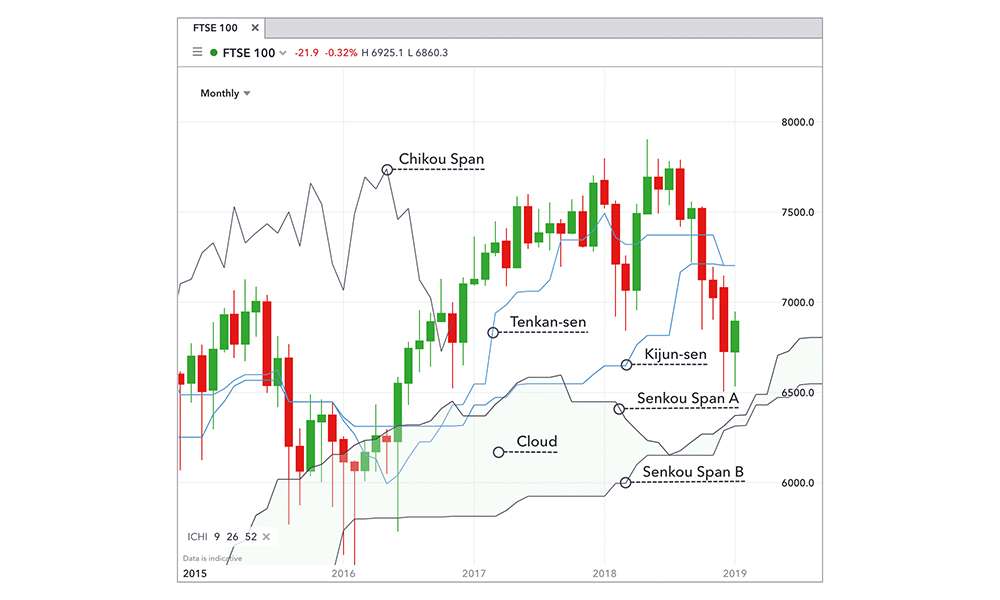
This comprehensive indicator consists of five lines that provide a wealth of information:
- Tenkan-sen (Conversion Line).
- Kijun-sen (Base Line).
- Senkou Span A (Leading Span A).
- Senkou Span B (Leading Span B).
- Chikou Span (Lagging Span.
The Ichimoku Cloud helps traders:
- Identify support and resistance levels.
- Gauge trend direction and strength.
- Generate trading signals based on line crossovers.
While initially complex, mastering the Ichimoku Cloud can offer a significant advantage in market analysis.
Stochastic Oscillator: Pinpointing Reversals
This momentum indicator compares a security’s closing price to its price range over a specific period. Oscillating between 0 and 100, it helps traders:
- Identify overbought (above 80) and oversold (below 20) conditions.
- Spot potential price reversals.
- Confirm trend strength.
The Stochastic Oscillator is particularly useful in range-bound markets and for timing entries and exits.
Bollinger Bands: Volatility Visualized
Consisting of a moving average and two standard deviation lines, Bollinger Bands help traders:
- Identify potential breakouts.
- Spot trend reversals.
- Gauge market volatility.
As the bands expand and contract with market volatility, they provide valuable insights into potential price movements and trend strength.
Keltner Channels: The Adaptive Trend Follower
Similar to Bollinger Bands, Keltner Channels use an exponential moving average and average true range (ATR) to create a dynamic price envelope. This indicator helps traders:
- Identify trend direction.
- Spot potential reversals.
- Assess market volatility.
Keltner Channels can be particularly effective in trending markets and for setting stop-loss levels.
Market Profile: Volume and Price in Harmony
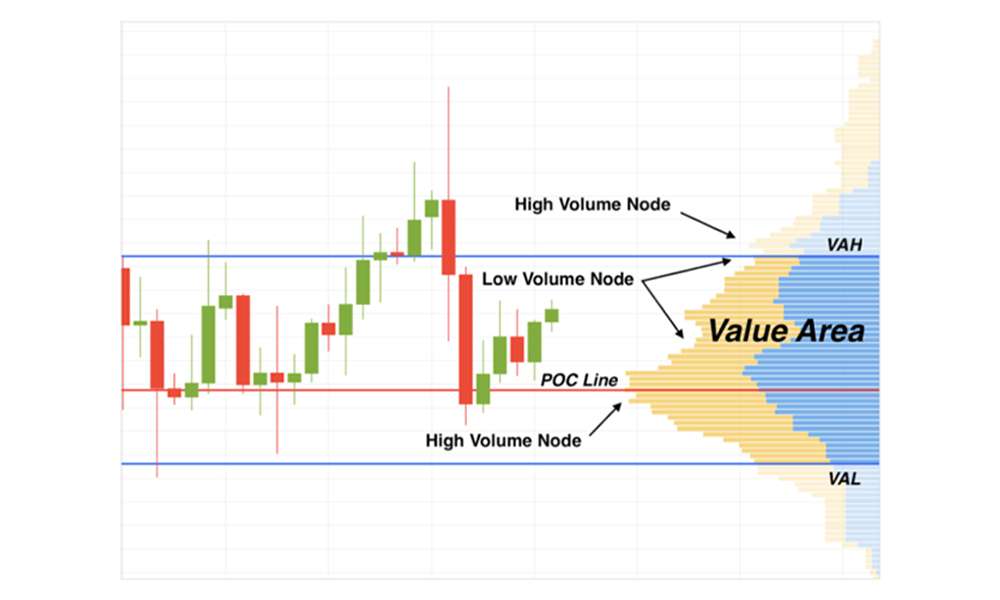
This unique indicator displays the distribution of trading activity over time, using Time Price Opportunities (TPOs). Market Profile helps traders:
- Identify key support and resistance levels.
- Spot value areas and market imbalances.
- Understand market structure and participant behavior.
While less common than other indicators, Market Profile can provide deep insights into market dynamics and potential price movements.
Implementing Unconventional Indicators in Your Trading Strategy
To effectively use these unconventional indicators:
- Study each indicator thoroughly to understand its strengths and limitations.
- Practice applying the indicators in different market conditions.
- Combine multiple indicators for confirmation and to reduce false signals.
- Continuously refine your approach based on market feedback and performance.
Remember, no indicator is infallible. Always use these tools in conjunction with sound risk management principles and a well-defined trading plan.
Conclusion
By incorporating these seven unconventional trading indicators into your analysis toolkit, you can gain a significant edge in the markets. From momentum assessment with RSI to market structure insights with Market Profile, these tools offer a diverse range of analytical perspectives.
As you explore and implement these indicators, remember that successful trading is a journey of continuous learning and adaptation. Stay curious, remain disciplined, and always be open to refining your approach based on market realities.
Embrace the power of unconventional indicators and take your trading to the next level. With practice and persistence, these tools can help you make more informed decisions and potentially boost your trading performance in today’s dynamic financial markets.
Mastering Trading Indicators on Traderverse
The best way to learn trading indicators is by applying them in real time and seeing how other experienced traders use them. On Traderverse, you can follow traders who share their chart setups and see which trading indicators drive their decisions.
Combine these trading indicators with proven strategies from our Jesse Livermore trading wisdom guide, and join the conversation on Traderverse.
For deeper technical analysis education, see StockCharts ChartSchool and indicator research from Investopedia.